
Mixed Graphs
Mixed Graphs: Overview
This topic covers concepts, such as, Mixed Graphs, Mixed Graphs of Line and Pie Charts, Mixed Graphs of Bar and Web Charts & Mixed Graphs of Web and Table Charts etc.
Important Questions on Mixed Graphs
Read the following graph and table carefully and answer the question given below.
Total number of employees
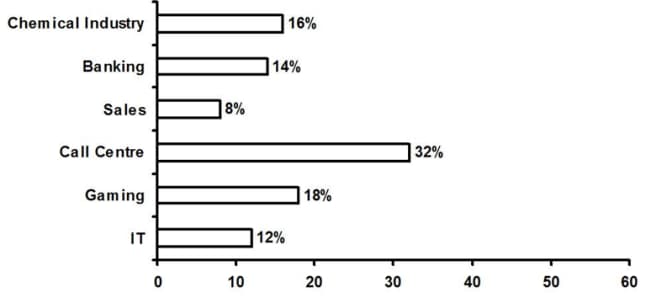
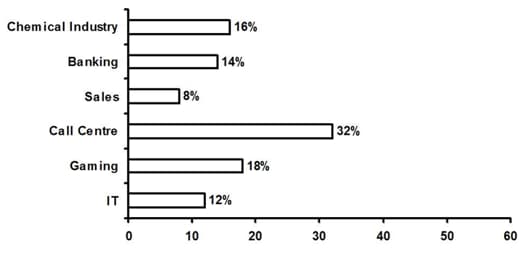
Percent of employees working in the night shift from different industries in a city:
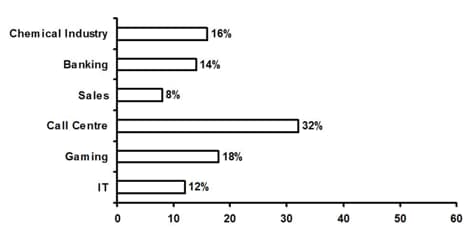
| Industries | Percent of Women |
| IT | |
| Gaming | |
| Call Centre | |
| Sales | |
| Banking | |
| Chemical Industry |
What is the difference between the number of working males in Call Centre and Sales industries?
Study the following graph and answer the question given below:
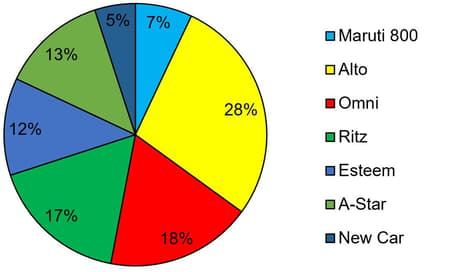
The below graph shows the per cent growth of Maruti cars produced in successive year.

The below pie-charts represents the percentage distribution of different cars in different years.
Percentage distribution of different Cars in .
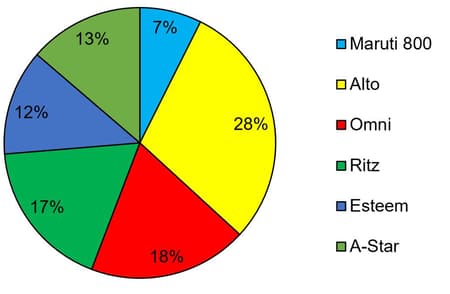
Percentage distribution of Cars in .
Read the following graph carefully and answer the questions given below:
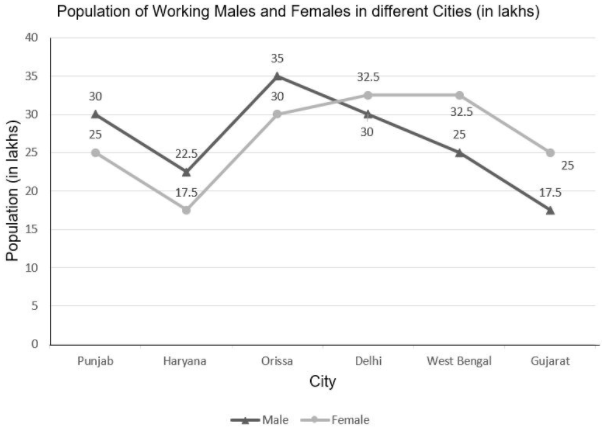
The below graph shows the population of working males and females (in ) in different cities.
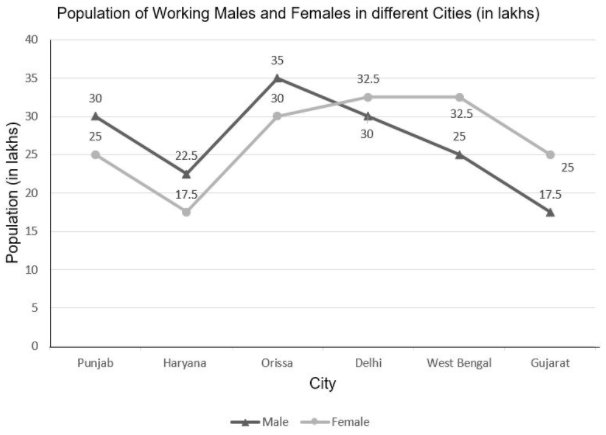
The below pie-chart shows the percentage distribution of the income of persons of different cities.
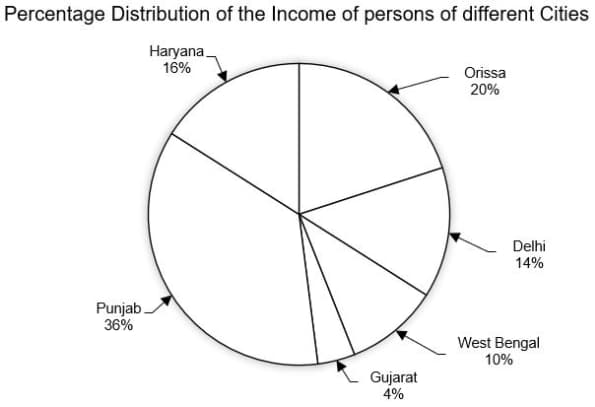
The total income is .
 In which of the following cities is the per capita income the maximum?
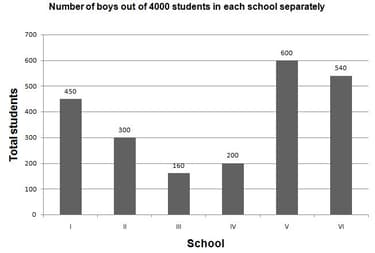
Study the graphs carefully to answer the following question:
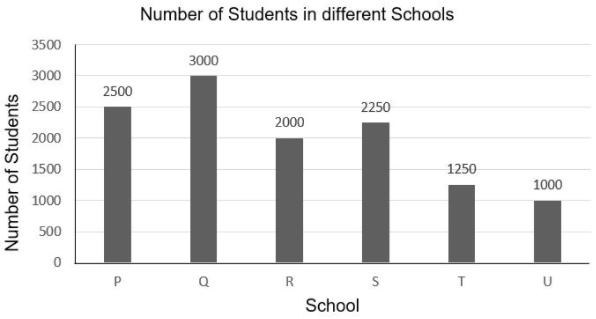
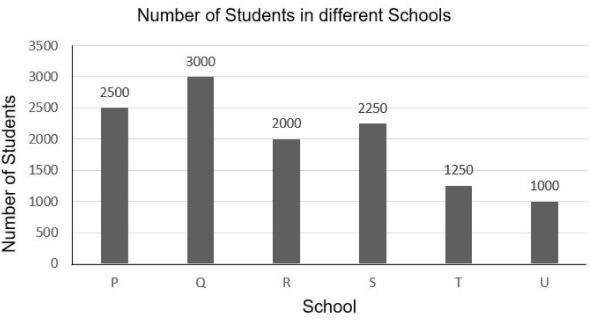
The below bar graph represents the total number of students in different schools.
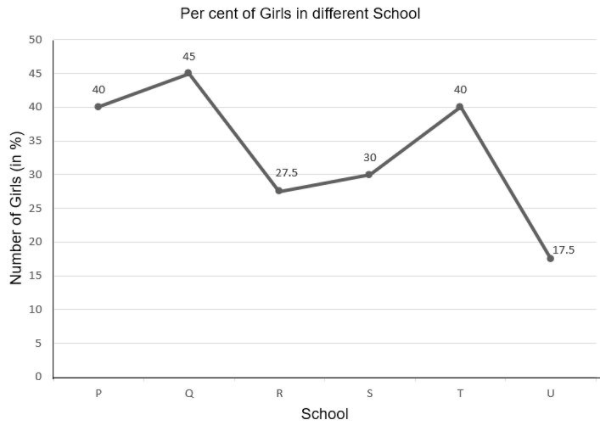
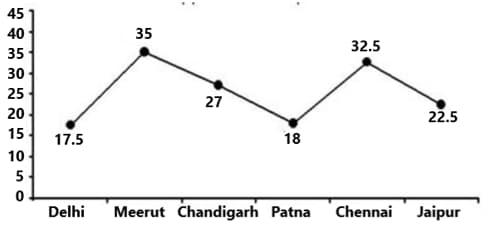
The below line graph represents the percentage of girls different schools.
The total number of students in school is approximately what percent of the total number of students in school ?
Study the following graph and pie-chart carefully and give the answer of the following question.
Percentage wise distribution of students in six different schools.
Total number of students
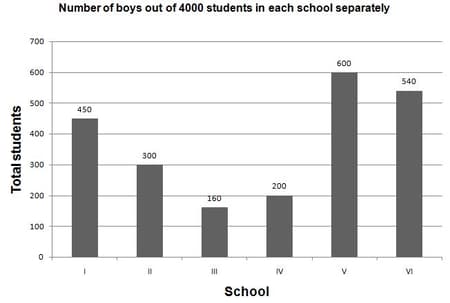
Pie chart shows the percentage wise distribution of students in six different schools
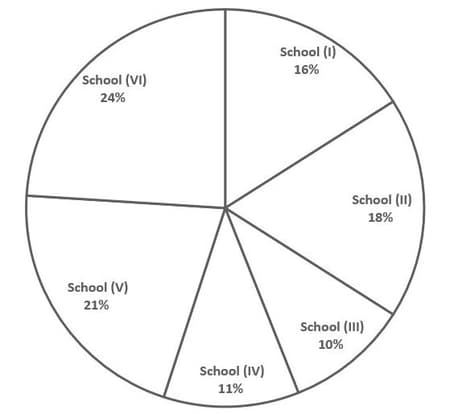
Number of boys in school is approximately what % of total number of students in school
Read the following graph and table carefully and answer the question given below.
Total number of employees
Percent of employees working in the night shift from different industries in a city:
| Industries | Percent of Women |
| IT | |
| Gaming | |
| Call Centre | |
| Sales | |
| Banking | |
| Chemical Industry |
In which two industries the number of working women are equal?
Read the following graph carefully and answer the questions given below:
The below graph shows the population of working males and females (in ) in different cities.
The below pie-chart shows the percentage distribution of the income of persons of different cities.
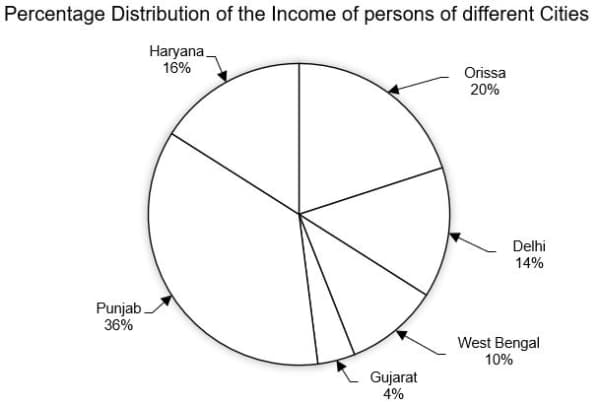
The total income is .
What is the per capita income in Haryana?
Study the following graph and answer the question given below:
The below graph shows the per cent growth of Maruti cars produced in successive year.

The below pie-charts represents the percentage distribution of different cars in different years.
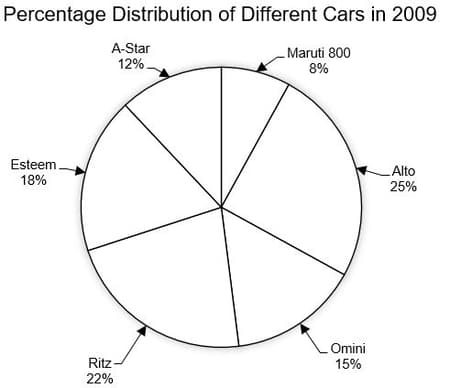

What is the ratio of Maruti Esteem produced to that of Maruti Omini in the year ?
Study the following graph carefully and give the answer to the following questions.
The below pie chart represents the Degrees wise distribution of employees in various departments in an organisation.
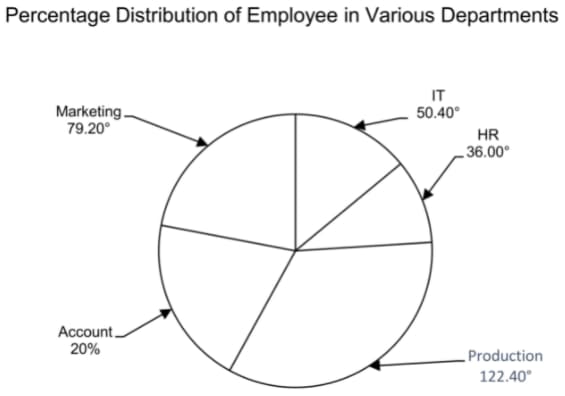
The below bar chart shows the ratio of male to female in their respective department.
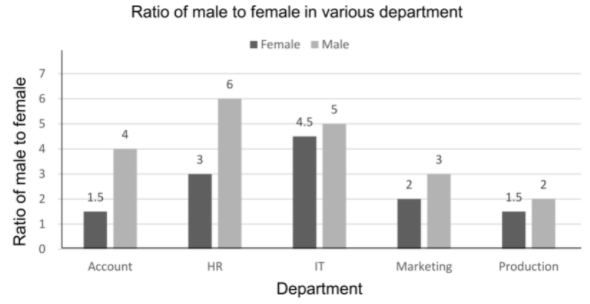
What is the respective ratio of employees in the accounting department to the employees in the marketing department?
Read the following graph and table carefully and answer the questions given below.
The ratio of females and males in institutes
| Institute Year↓ |
A |
B |
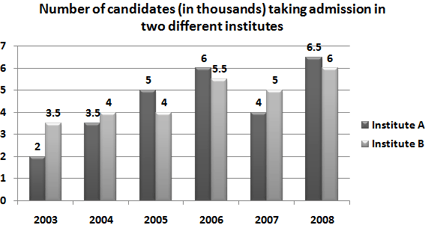
What is the average number of males in institute B in all the years?
Study the following information and answer the questions that follow:
The graph given below represents the production (in tonnes) and sales (in tonnes) of company A from -.
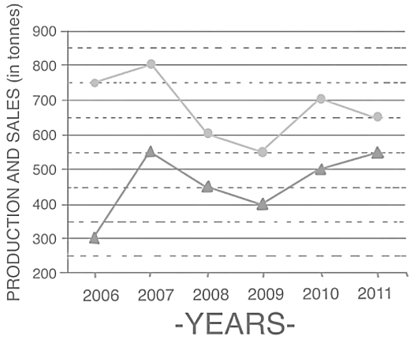
The table given below represents the respective ratio of the production (in tonnes) of Company A to the production (in tonnes) of Company B, and the respective ratio of the sales (in tonnes) of Company A to the sales (in tonnes) of Company B.
| Year | Production | Sales |
What is the approximate percentage increase in the production of Company A (in tonnes) from the year to the production of Company A (in tonnes) in the year ?
Study the following graph and answer the question given below:
The below graph shows the per cent growth of Maruti cars produced in successive year.
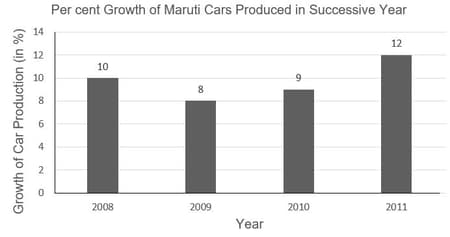
The below pie-charts represents the percentage distribution of different cars in different years.

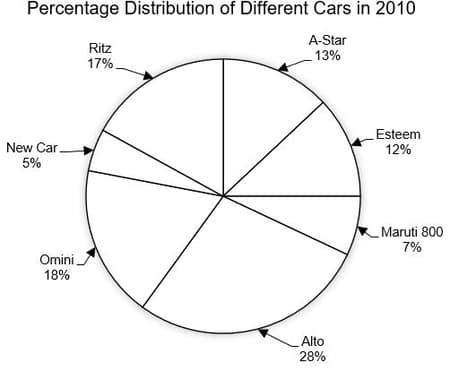
If the total car produced in the year is then what is approx percentage increase / decrease in the production of Alto in with respect to its previous year?
Study the following graph and pie-chart carefully and give the answer of the following question.
Percentage wise distribution of students in six different schools.
Total number of students
Pie chart shows the percentage wise distribution of students in six different schools

What is the percentage number of girls in school & to that of total number of boys?
Study the graphs carefully to answer the following question:
The below bar graph represents the total number of students in different schools.
The below line graph represents the percentage of girls different schools.

 What is the total number of boys in school ?
Read the following graph carefully and answer the question given below.
Number of students in different cities (in thousands):
| Ratio of boys and girls | |
| City | Boys Girls |
| Delhi | |
| Meerut | |
| Chandigarh | |
| Patna | |
| Chennai | |
| Jaipur | |
The number of girls in Jaipur is approximately what percent of the number of boys in Chennai?
The following question is to be answered on the basis of the information available in the following graphs.
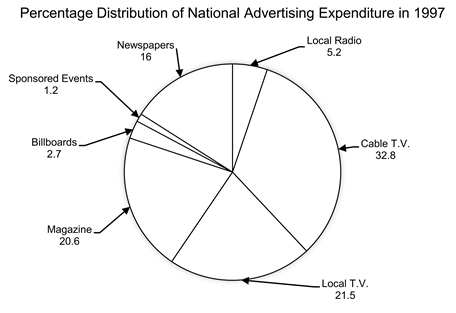
The below pie chart represents the percentage distribution of National Advertising Expenditure in .
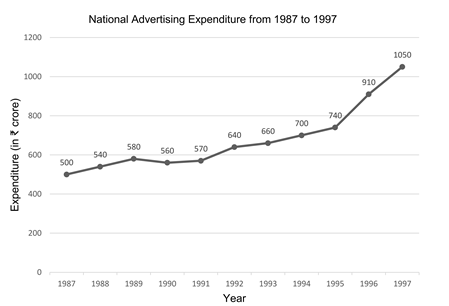
The below line graph represents the data for the National Advertising Expenditure from to .
Read the following graph and table carefully and answer the question given below.
Total number of employees
Percent of employees working in the night shift from different industries in a city:
| Industries | Percent of Women |
| IT | |
| Gaming | |
| Call Centre | |
| Sales | |
| Banking | |
| Chemical Industry |
The number of working females in Gaming is approximately what percent more than the number of working females in IT?
Read the following graph and table carefully and answer the question given below.
Total number of employees
Percent of employees working in the night shift from different industries in a city: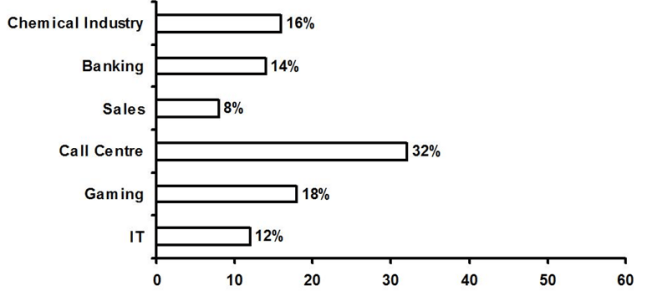
| Industries | Percent of Women |
| IT | |
| Gaming | |
| Call Centre | |
| Sales | |
| Banking | |
| Chemical Industry |
What is the respective ratio between the number of males working in Sales and Chemical industries?
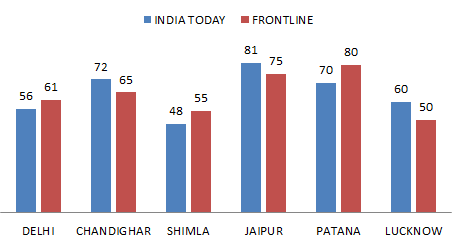
Study the following graph and table carefully and answer the question given below.
Number of readers (in thousands) of two magazines in different cities in
| CITIES | INCREASE IN NUMBER OF READERS IN INDIA TODAY (2012 TO 2013) | INCREASE IN NUMBER OF READERS IN FRONTLINE (2012 TO 2013) |
| DELHI | ||
| CHANDIGHAR | ||
| SHIMLA | ||
| JAIPUR | ||
| PATNA | ||
| LUCKNOW |
What is the respective ratio of number of readers of India Today in Patna in and that of Frontline in Chandigarh in the same year?
Study the following graphs to answer the questions that follow:
The pie chart shows the percentage of graduate employees in various departments of M/s PQR Ltd.
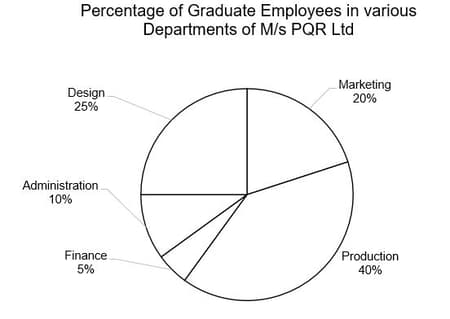
The number of graduate employees is .
The bar graph shows the number of employees in various departments of M/s PQR Ltd. and Other than graduate employees are those employees who are either post-graduates or undergraduates.
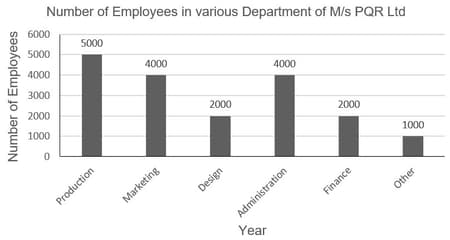
The number of employees is .
What percentage of other than graduate employees are there in Marketing and Design departments together?


